使っていない画像機能を外したら、メモリは1GiB減り、速度は変わらなかった Dropping an Unused Image Feature Saved 1 GiB of Memory and Didn't Change Speed
はじめに
プロンプトキャッシュの回で、サーバの起動ログにこの行を見つけました。
srv load_model: cache_reuse is not supported by multimodal, it will be disabled使っている Qwen3.6-35B-A3B は画像も扱えるモデルで、
-hf で指定すると画像用の mmproj(約 0.9 GB のファイル)が自動で読み込まれます。
ところが、llm コマンドも dev-orchestra のレビューも、テキストしか使っていません。
使わない機能のために、毎回ファイルを読んでメモリを使っていたことになります。
外したら何が変わるのか。候補は 3 つありました。
- メモリが減る(ほぼ確実)
- 起動が速くなる(読むファイルが 1 つ減る)
- 読み込み・生成が速くなる(llama-bench と実サーバの速度差、約 2 割の原因かもしれない)
3 つ目が当たれば、毎日の llm がそのまま速くなります。
チェックリストから設計する
前回、測定で 19 回間違えた経験をチェックリストにまとめました。 今回はそれを最初から当てはめています。
| チェック項目 | 今回の対応 |
|---|---|
| 設定が本当に有効か | 起動ログに mmproj の読み込み行が出ていないことを確かめ、想定と違えば止まる |
| 比べ方 | あり → なし → あり → なし → あり と交互に 5 回。最初と最後の「あり」が揃うかでずれを見る |
| 本番と同じ条件 | serve.ps1 と同じ引数(-c 65536、MTP あり)。違いは --no-mmproj だけ |
| 割り込み | llama 以外が使った CPU・GPU を 10 秒ごとに記録 |
| 安全装置 | スリープ抑止が効かなければ止まる。サーバが起動しなければ止まる |
| 生データ | 生成した文章の冒頭を記録し、両条件でまともな出力かを見る |
1 つ目は --cache-reuse の件の反省です。
「入れた設定が効いているはず」で 4 日間間違えていたので、効いていなければ計測自体を止めるようにしました。
測ったのは、起動時間、メモリ、32K トークンの読み込み時間、生成速度(256 トークン × 3 回)です。
1 回目の結果
| # | mmproj | 起動 | メモリ(起動後) | 生成(平均) | 32K の読み込み |
|---|---|---|---|---|---|
| 1 | あり | 9.7 秒 | 25.11 GiB | 18.00 t/s | 140.4 秒 |
| 2 | なし | 8.3 秒 | 24.12 GiB | 19.13 t/s | 133.6 秒 |
| 3 | あり | 9.4 秒 | 25.21 GiB | 18.42 t/s | 144.9 秒 |
| 4 | なし | 9.6 秒 | 24.12 GiB | 17.25 t/s | 134.9 秒 |
| 5 | あり | 10.1 秒 | 25.21 GiB | 19.22 t/s | 125.5 秒 |
メモリは、はっきり 1 GiB 減った
「あり」は 25.11〜25.21 GiB、「なし」は 2 回とも 24.12 GiB。差は約 1.0 GiB です。 5 回の中で値がほとんど動かず、両者の範囲は重なりません。これは言い切れます。
速度は、何も言えなかった
一方で速度は、表を見ても方向が定まりません。 生成は「なし」の 1 回目が速く、2 回目が遅い。読み込みは「なし」が真ん中あたりに来ています。
決め手は、最初と最後の「あり」が揃っていないことでした。
| #1(あり) | #5(あり) | ずれ | |
|---|---|---|---|
| 32K の読み込み | 140.4 秒 | 125.5 秒 | −11% |
| 生成 | 18.00 t/s | 19.22 t/s | +7% |
同じ条件なのに、計測の始めと終わりで 1 割動いています。 「あり」どうしのばらつき(読み込み 125〜145 秒)の中に、「なし」の 134 秒がすっぽり収まっています。
条件の差より、計測中のずれのほうが大きい。 この状態で「速くなった」とも「変わらない」とも言えません。 挟み込みで測ったおかげで、それが分かったとも言えます。 1 回ずつの比較だったら、#4 と #5 を並べて「mmproj ありのほうが速い」と書いていたかもしれません。
監視に引っかかったもの
監視ログを見ると、16:14〜16:20 に llama 以外の CPU が 13〜22% まで上がっていました。 上位は python3.13 と StreamDeck です。python3.13 は計測スクリプトではありません。
調べると、この PC の Python は Microsoft Store 版の 3.13 で、プロセス名が python3.13 と見えます。
そして同じ時間帯に、別の Claude のセッションが dev-orchestra で作業していました。
dev-orchestra はこの Python で動くツールです。裏で動いていたのは、それだと見ています
(別セッションのログまでは確かめていないので、状況からの判断です)。
この区間は #3 の終盤と #4 にあたります。#4 の生成(17.25 t/s)が低いのは、その影響かもしれません。 ただ、重なっていない #1 と #5 のあいだでも 1 割ずれているので、ずれの原因がこれだけとは言えません。
裏を止めて、測り直した
チェックリストの「割り込み」に**「別の Claude のセッションが動いていないか確かめる」**を足し、測り直しました。
測り始める前に確かめると、dev-orchestra のセッションの最終操作が 40 秒前でした。 まさに使われていたわけです。そのセッションを止めてもらい、python のプロセスが無いことを確かめてから始めました。
回数も増やしています。あり → なし を交互に 7 回(あり 4 回、なし 3 回)。 こうすると「なし」の各回を、前後の「あり」の平均と比べられます。 計測中にゆっくりずれていっても、前後で挟めば打ち消せます。
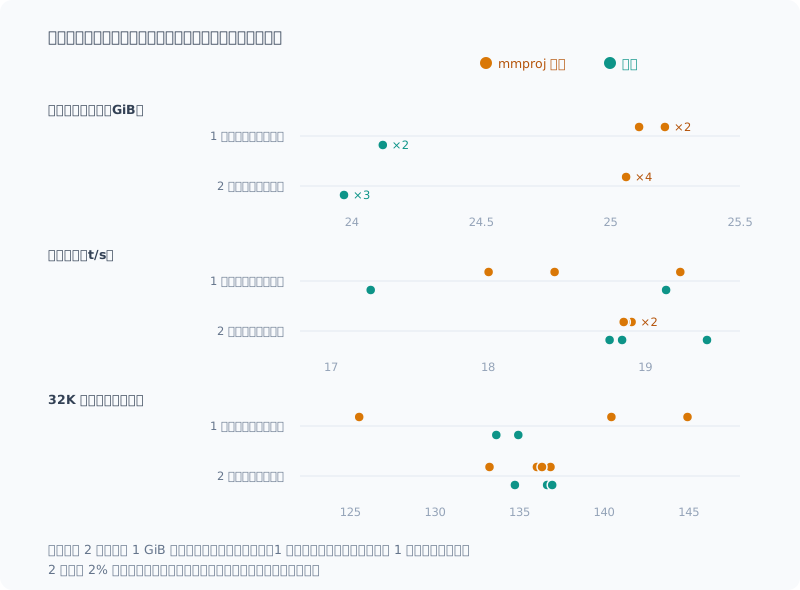
| # | mmproj | 起動 | メモリ(起動後) | 生成(平均) | 32K の読み込み |
|---|---|---|---|---|---|
| 1 | あり | 25.0 秒 ※ | 25.06 GiB | 18.91 t/s | 133.2 秒 |
| 2 | なし | 8.3 秒 | 23.97 GiB | 19.39 t/s | 136.6 秒 |
| 3 | あり | 8.0 秒 | 25.06 GiB | 18.87 t/s | 136.0 秒 |
| 4 | なし | 7.1 秒 | 23.97 GiB | 18.77 t/s | 134.7 秒 |
| 5 | あり | 8.1 秒 | 25.06 GiB | 18.91 t/s | 136.8 秒 |
| 6 | なし | 7.3 秒 | 23.97 GiB | 18.85 t/s | 136.9 秒 |
| 7 | あり | 7.8 秒 | 25.06 GiB | 18.86 t/s | 136.3 秒 |
※ #1 は、直前まで動いていたサーバを止めた直後の起動です。
監視では、llama 以外の CPU は中央値 7.1% で、1 回目のような連続した山はありませんでした。
ずれが、1 割から 2% 前後まで縮みました。
| 生成 | 32K の読み込み | |
|---|---|---|
| 最初と最後の「あり」(#1 と #7) | −0.2% | +2.3% |
| #2(なし)と前後の「あり」 | +2.6% | +1.5% |
| #4(なし)と前後の「あり」 | −0.6% | −1.2% |
| #6(なし)と前後の「あり」 | −0.2% | +0.3% |
「なし」と前後の「あり」の差は、向きが回ごとにばらばらで、大きさは 3% 以内です。 mmproj を外しても速度は変わらない、と言ってよさそうです。 正確には、差があったとしても 3% 未満です。
メモリは今回も、7 回とも同じ値でした(あり 25.06 GiB、なし 23.97 GiB、差 1.09 GiB)。
1 回目の 1 割のずれが、すべて dev-orchestra のせいだったのかは分かりません。 重なっていない #1 と #5 のあいだでもずれていたからです。 ただ、裏を静かにしただけで、同じスクリプトのばらつきが 5 分の 1 になったのは確かです。
出力は一字一句同じ
2 回の計測の計 12 回とも、生成した文章は冒頭から同じでした。
ローカルLLMをiGPU(統合グラフィックス)で動作させる最大の利点は、専用メモリ(VRAM)を必要とせず、…mmproj は画像を読むための部品なので、テキストだけなら影響しないのは予想どおりです。 ただ、予想どおりかどうかも確かめておくのが、今回のやり方です。
期待していた 2 つは外れた
--cache-reuse は、外しても使えませんでした。
srv load_model: cache_reuse is not supported by this context, it will be disabled理由が「マルチモーダルだから」から「このコンテキストでは非対応」に変わるだけです。 このモデルは SSM とのハイブリッド構成で、KV をずらして使い回す仕組みとは両立しません。 前回確かめたとおりでした。
llama-bench と実サーバの速度差も、mmproj では説明できませんでした。 読み込みが 2 割速くなれば当たりでしたが、測り直した結果は 3% 未満の差です。原因は未解明のままです。
既定を変えた
既定は mmproj なしにしました。
| あり | なし | |
|---|---|---|
| メモリ | 約 25.1 GiB | 約 24.0 GiB |
| 起動 | 約 8 秒 | 約 7〜8 秒 |
| テキストの出力 | — | 同じ |
| 画像の入力 | 使える | 使えない |
失うのは画像の入力だけで、今は使っていません。 93.6 GiB 積んだ機体で 1 GiB は小さな差です。それでも、使わない機能のためにメモリを使い続ける理由もありません。
serve.ps1 には -Vision を足し、画像が必要なときだけ読み込めるようにしました。
# 普段(llm の自動起動もこちら)
pwsh -File scripts\serve.ps1            # --no-mmproj が付く

# 画像を使うとき
llm -Stop
pwsh -File scripts\serve.ps1 -Vision    # mmproj を読み込む
変更後に llm から自動起動させ、--no-mmproj 付きで立ち上がって応答が返ること、
メモリが 24.27 GiB になっていることを確認しています。
まとめ
- テキストしか使わないのに、画像用の mmproj を毎回読み込んでいた
- 外すとメモリが約 1 GiB 減る。2 回の計測の 12 回ともほぼ同じ値で、言い切れる
- 1 回目は同じ条件の最初と最後が 1 割ずれ、速度について何も言えなかった
- 裏で別の Claude のセッションが dev-orchestra を動かしていた。止めて測り直すと、ずれは 2% 前後に縮んだ
- 測り直した結果、速度の差は 3% 未満。mmproj を外しても速くも遅くもならない
--cache-reuseは外しても使えず、llama-bench との速度差の原因でもなかった- 既定は mmproj なしに変更。画像を使うときは
-Vision
速くなる話を期待して測り始めましたが、速さは変わらず、確かに得たのは 1 GiB のメモリでした。
1 回目で「分からない」と書けたのも、2 回目で「変わらない」と言えるようになったのも、 挟み込みで測って、ずれの大きさを見ていたからです。 そして、ずれを 5 分の 1 にしたのは、測り方ではなく裏を静かにしたことでした。
Introduction
In the prompt cache post, I spotted this line in the server’s startup log.
srv load_model: cache_reuse is not supported by multimodal, it will be disabledThe model I use, Qwen3.6-35B-A3B, can also handle images.
When you specify it with -hf, the image mmproj (a file of about 0.9 GB) is loaded automatically.
But neither the llm command nor the dev-orchestra reviews use anything but text.
So every time, I was reading a file and spending memory on a feature I never use.
What changes if I drop it? I had three candidates.
- Memory goes down (almost certain)
- Startup gets faster (one less file to read)
- Loading and generation get faster (it might be the cause of the roughly 20% speed gap between llama-bench and the real server)
If the third one hit, my daily llm would get faster as it is.
Designing from the Checklist
In my previous post, I turned 19 measurement mistakes into a checklist. This time I applied it from the start.
| Checklist item | What I did this time |
|---|---|
| Is the setting really in effect? | Check that the mmproj loading line does not appear in the startup log, and stop if it differs from what I expect |
| How to compare | Alternate with → without → with → without → with, 5 runs. Use whether the first and last “with” runs match to see drift |
| Same conditions as production | Same arguments as serve.ps1 (-c 65536, MTP on). The only difference is --no-mmproj |
| Interference | Record CPU and GPU used by anything other than llama every 10 seconds |
| Safety stops | Stop if sleep prevention doesn’t work. Stop if the server doesn’t start |
| Raw data | Record the beginning of the generated text, and check both conditions produce sane output |
The first item comes from the lesson of the --cache-reuse episode.
I was wrong for four days because I assumed “the setting I added must be working”, so now if it isn’t in effect, the measurement itself stops.
I measured startup time, memory, time to load 32K tokens, and generation speed (256 tokens × 3 runs).
Results of the First Run
| # | mmproj | Startup | Memory (after startup) | Generation (avg) | Loading 32K |
|---|---|---|---|---|---|
| 1 | with | 9.7 s | 25.11 GiB | 18.00 t/s | 140.4 s |
| 2 | without | 8.3 s | 24.12 GiB | 19.13 t/s | 133.6 s |
| 3 | with | 9.4 s | 25.21 GiB | 18.42 t/s | 144.9 s |
| 4 | without | 9.6 s | 24.12 GiB | 17.25 t/s | 134.9 s |
| 5 | with | 10.1 s | 25.21 GiB | 19.22 t/s | 125.5 s |
Memory Clearly Dropped by 1 GiB
“With” was 25.11–25.21 GiB, and “without” was 24.12 GiB both times. The difference is about 1.0 GiB. The values barely moved across the 5 runs, and the two ranges don’t overlap. This I can state with confidence.
On Speed, I Couldn’t Say Anything
Speed, on the other hand, shows no clear direction in the table. For generation, the first “without” run is fast and the second is slow. For loading, “without” lands somewhere in the middle.
The deciding factor was that the first and last “with” runs didn’t match.
| #1 (with) | #5 (with) | Drift | |
|---|---|---|---|
| Loading 32K | 140.4 s | 125.5 s | −11% |
| Generation | 18.00 t/s | 19.22 t/s | +7% |
Same conditions, yet the numbers moved by 10% between the start and end of the measurement. The “without” value of 134 seconds sits right inside the spread among the “with” runs (loading 125–145 seconds).
The drift during measurement was larger than the difference between conditions. In this state, I can say neither “it got faster” nor “it didn’t change”. You could also say that interleaving the runs is what showed me this. If I had compared one run each, I might have put #4 and #5 side by side and written “it’s faster with mmproj”.
What the Monitoring Caught
Looking at the monitoring log, CPU use by things other than llama rose to 13–22% between 16:14 and 16:20. The top processes were python3.13 and StreamDeck. python3.13 is not the measurement script.
When I looked into it, the Python on this PC is the Microsoft Store version 3.13, and its process name shows up as python3.13.
And during the same period, another Claude session was working with dev-orchestra.
dev-orchestra is a tool that runs on this Python. I believe that’s what was running in the background
(I didn’t check the other session’s logs, so this is a judgment from the circumstances).
That window covers the end of #3 and #4. The low generation speed in #4 (17.25 t/s) might be due to it. But #1 and #5, which don’t overlap that window, also drift by 10%, so I can’t say this was the only cause of the drift.
Stopping the Background Work and Measuring Again
I added “check that no other Claude session is running” to the “Interference” item of the checklist, and measured again.
When I checked before starting, the last activity in the dev-orchestra session was 40 seconds ago. It really was in use. I had that session stopped, confirmed there were no python processes, and then started.
I also increased the number of runs: alternating with → without 7 times (4 with, 3 without). That way I can compare each “without” run with the average of the “with” runs before and after it. Even if things drift slowly during measurement, bracketing them before and after cancels it out.
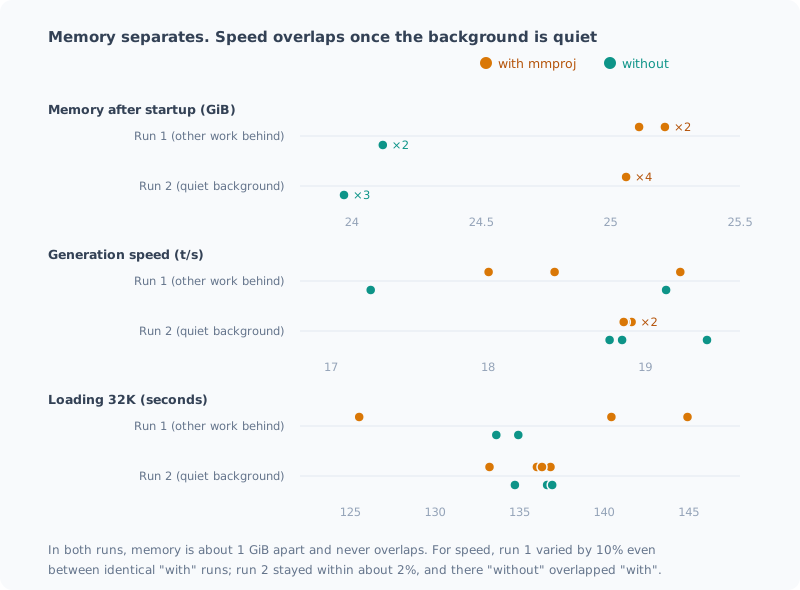
| # | mmproj | Startup | Memory (after startup) | Generation (avg) | Loading 32K |
|---|---|---|---|---|---|
| 1 | with | 25.0 s * | 25.06 GiB | 18.91 t/s | 133.2 s |
| 2 | without | 8.3 s | 23.97 GiB | 19.39 t/s | 136.6 s |
| 3 | with | 8.0 s | 25.06 GiB | 18.87 t/s | 136.0 s |
| 4 | without | 7.1 s | 23.97 GiB | 18.77 t/s | 134.7 s |
| 5 | with | 8.1 s | 25.06 GiB | 18.91 t/s | 136.8 s |
| 6 | without | 7.3 s | 23.97 GiB | 18.85 t/s | 136.9 s |
| 7 | with | 7.8 s | 25.06 GiB | 18.86 t/s | 136.3 s |
* #1 was started right after stopping the server that had been running until just before.
In the monitoring, CPU use by things other than llama had a median of 7.1%, with no sustained peak like in the first run.
The drift shrank from 10% to around 2%.
| Generation | Loading 32K | |
|---|---|---|
| First and last “with” (#1 and #7) | −0.2% | +2.3% |
| #2 (without) vs. the “with” runs around it | +2.6% | +1.5% |
| #4 (without) vs. the “with” runs around it | −0.6% | −1.2% |
| #6 (without) vs. the “with” runs around it | −0.2% | +0.3% |
The difference between “without” and the “with” runs around it changes direction from run to run and stays within 3%. I think it’s fair to say dropping mmproj doesn’t change speed. More precisely, if there is a difference, it’s under 3%.
Memory was again the same in all 7 runs (with: 25.06 GiB, without: 23.97 GiB, a difference of 1.09 GiB).
I don’t know whether the 10% drift in the first run was entirely due to dev-orchestra, because it drifted between #1 and #5 too, which didn’t overlap that window. But it’s certain that just quieting the background cut the spread of the same script to one fifth.
The Output Is Identical, Word for Word
In all 12 runs across the two measurements, the generated text was the same from the start.
ローカルLLMをiGPU(統合グラフィックス)で動作させる最大の利点は、専用メモリ(VRAM)を必要とせず、…mmproj is the part that reads images, so as expected it has no effect on text only. Still, checking whether things really are as expected is how I did it this time.
The Two Things I Hoped For Didn’t Pan Out
--cache-reuse still couldn’t be used after dropping it.
srv load_model: cache_reuse is not supported by this context, it will be disabledThe reason just changes from “because it’s multimodal” to “not supported in this context”. This model is a hybrid with SSM, and it can’t coexist with a mechanism that shifts and reuses the KV. It was just as I confirmed last time.
The speed gap between llama-bench and the real server couldn’t be explained by mmproj either. If loading had become 20% faster, that would have been the answer, but the remeasured difference is under 3%. The cause remains unknown.
I Changed the Default
I made “without mmproj” the default.
| With | Without | |
|---|---|---|
| Memory | about 25.1 GiB | about 24.0 GiB |
| Startup | about 8 s | about 7–8 s |
| Text output | — | Same |
| Image input | Available | Not available |
The only thing I lose is image input, which I don’t use now. On a machine with 93.6 GiB, 1 GiB is a small difference. Still, there’s no reason to keep spending memory on a feature I don’t use.
I added -Vision to serve.ps1, so images are loaded only when I need them.
# 普段(llm の自動起動もこちら)
pwsh -File scripts\serve.ps1            # --no-mmproj が付く

# 画像を使うとき
llm -Stop
pwsh -File scripts\serve.ps1 -Vision    # mmproj を読み込む
After the change, I had llm start the server automatically and confirmed that it came up with --no-mmproj, returned a response,
and that memory was at 24.27 GiB.
Summary
- I only use text, yet the image mmproj was loaded every time
- Dropping it reduces memory by about 1 GiB. All 12 runs across the two measurements showed nearly the same value, so I can state this with confidence
- In the first run, the first and last runs of the same condition drifted by 10%, and I couldn’t say anything about speed
- In the background, another Claude session was running dev-orchestra. After stopping it and measuring again, the drift shrank to around 2%
- The remeasured speed difference is under 3%. Dropping mmproj makes things neither faster nor slower
--cache-reusestill couldn’t be used after dropping it, and mmproj wasn’t the cause of the speed gap with llama-bench either- I changed the default to no mmproj. When I need images, I use
-Vision
I started measuring hoping for a speedup, but speed didn’t change, and what I actually gained was 1 GiB of memory.
That I could write “I don’t know” after the first run, and say “it doesn’t change” after the second, is because I measured with interleaved runs and watched the size of the drift. And what cut the drift to one fifth wasn’t the measurement method but quieting the background.
関連記事 Related Posts
128K の文書の奥まで、ちゃんと読めているのか Can It Really Read All the Way into a 128K Document?
ローカルLLMに128Kトークンの文書を読ませ、20か所に仕込んだ事実を拾えるか測りました。深さによる取りこぼしは無く、文書に無いことは「記載なし」と答えました。唯一の誤りは、先頭2文字が同じ別の番号との取り違えで、片方の名前を変えると消えました。 I had a local LLM read a 128K-token document and measured whether it could pick up facts planted in 20 places. Nothing was missed because of depth, and for things not in the document it answered "not stated". The only mistake was mixing up a different ID that shared its first two characters, and it went away when I renamed one of them.
128K の文書は、読ませ直さずに使い回せるのか Can a 128K Document Be Reused Without Reading It Again?
ローカルLLMに128Kトークンの文書を読ませると20分以上かかります。2回目以降を速くできるか、プロンプトキャッシュを6通りの使い方で測りました。質問を変えるだけなら数秒で済みますが、ディスクに保存して再起動すると全部読み直しになります。理由はモデルのハイブリッド構成にありました。以前の記事の誤りも見つかりました。 Having a local LLM read a 128K-token document takes over 20 minutes. To see whether later requests can be faster, I measured the prompt cache in 6 scenarios. Changing just the question takes seconds, but saving to disk and restarting means re-reading everything. The reason lies in the model's hybrid architecture. I also found a mistake in an earlier post.
コンテキストを 128K まで伸ばしたら、壁はメモリではなく待ち時間だった I Stretched the Context to 128K, and the Wall Was Waiting Time, Not Memory
ローカルLLMのコンテキストを32Kから128Kまで伸ばして測りました。予想していたメモリ不足は起きず、理由はモデルの構造にありました。代わりに見えた壁はプロンプトの取り込み時間で、128Kを読ませるだけで21〜24分かかります。途中で自分の自動起動に計測を汚された話も含みます。 I stretched my local LLM's context from 32K to 128K and measured it. The memory shortage I expected never happened, and the reason lay in the model's architecture. The wall I hit instead was prompt ingestion time: just reading 128K takes 21–24 minutes. It also covers how my own auto-start polluted the measurements along the way.